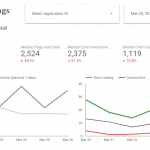
A quick guide on visualising Snowplow Analytics data (in this case: performance timing) in Google Data Studio.
Analyse Web Site Click Paths as Processes
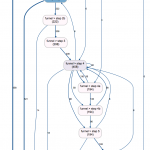
In this post, I’ll show you how to analyse and visualise click paths or “customer journeys” using process mining tools (via the bupaR R package). Including a sample dataset for you to play with.
Doing Cohort Analysis in R (using ggplot)
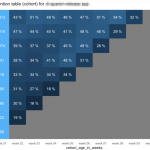
In this post I’ll describe how to build a nice cohort graph/table in R, using ggplot2.
Data source that I’m using is from a mobile app that is tagged with Snowplow Analytics, but if you follow all the steps, using a similar dataset, you’ll get the same results.