If you didn’t scratch your head while reading this blog post title, you probably well into Google Analytics. Welcome, web analyst!
This blog post will teach you a trick that solves an annoying shortcoming in Google Analytics Multi Channel Funnel reports:
- How many visits do you get for each multi channel funnel path?
- How can you calculate the conversion rate for each combination?
Read on to find out which marketing channels are making you the most money per visit..
How to calculate the conversion rate per path?
In Google Analytics, it’s not possible to see the number of visitors for each of the paths. Sigh.
Unless you do the following:
I’ll explain the steps first, then I’ll walk you through it.
- Create a view (or change your current view) with a new goal: every visit is a conversion
- Make sure you set your real goal as well (e.g. transactions, or a conversion goal)
- View the multi-channel funnel report for the goal created on step 1: these are your visits per path
- View the same report again, but then select the real goal: these are your conversions
- Find the matching paths and divide goals / visits and voila, there’s the conversion rate per path
Between step 2 and 3, you’ll have to wait, unfortunately. You cannot report goal completion in the period before you created the goal. But it’s worth the wait!
In an other blogpost, I explained how to do proper attribution modeling using this setup. Read it, it’s fun :)
Step 1: setting every visit as a conversion
 By default, every multi-channel funnel report only count conversions, so you need to create a conversion for each visit to count the total number of visits.
You can choose to create a new view (you’ll have to wait anyway for the data to come in) if you do not want your regular view to be polluted with this new goal. It’ll mess with your site-wide metrics.
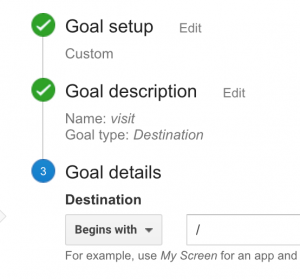
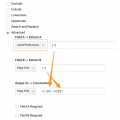
It’s faily easy. Go to Admin -> Goals, and under Goal Details, select Destination begins with /.
This will match all urls visited, and you’ll have a goal that triggers for every visit.
Congratulations: you now have 100% conversion rate, you can retire ;-)
Step 2: make sure to set up your real goal as well
Just to make sure: in the same view where you have your Visit = conversion goal, you should configure your real conversion goals as well, or set up e-commerce and measure transactions.
Now wait for the data to come in. But please read on first.
Step 3: view the Multi Channel Funnel report
You can choose any Multi-Channel Funnel report you like. My personal favorite is slightly hidden.
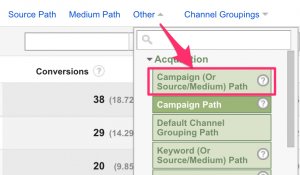
Select the MCF report, and select (it’s under Other) the Campaign (or Source/Medium) Path. A true hidden gem.
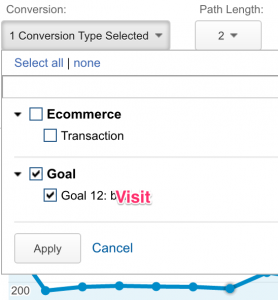 In order to find total visits, select your newly created goal (on step 1).
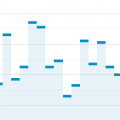
Now you see a report of all visits for the chosen multi channel funnel paths.
In order to do proper analysis of the results, I suggest you export this report to Excel or Google Sheets. Make sure you select a fairly large number of rows, since the number of followed paths can be quite large, and you want to match up similar rows later on.
Step 4: View the same report, but now choose your real goal
Ok, now de-select your all visits goal, and select the proper one, like transactions.
Again, save the report to Excel or Google Sheets, and you are ready to calculate the conversion rate per path. High five!
Step 5: calculate the conversion rate of each path
 You know how to calculate conversion rate, right? It’s conversion / visits. And now you have the data you want.
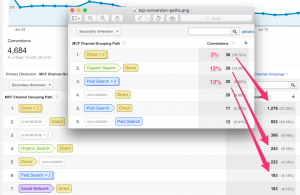
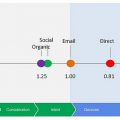
In the example image next to this paragraph, you’ll see that the most common conversion path [ Direct > Direct ] is actually not performing really well with a conversion rate of only 3%.
The true winners here are [ Organic > Direct ] and [ 2x Paid Search ] with a whopping 10%+ conversion rate!
You can of course do these calculations in a spreadsheet. Just match up similar rows with a SUMIF or VLOOKUP. Or reply with a comment here if you use formula’s that are more clever. I love spreadsheet formulas, don’t be shy.
The Next Step
Ok, with this new addition to your Google Analytics bag of tricks, you are not only ready to report on conversion rates per path, but you can also use this to do proper conversion attribution modeling.
In a follow-up post, I explained how to use this setup, the Google Analytics API, the R language, and the brilliant ChannelAttribution R package.
Meanwhile: you can message me on Twitter, or leave a comment here if you have any questions or remarks. Thanks, and happy analyzing!

Great post! Can’t wait for post about analyzing with R! :)
It’s here: https://stuifbergen.com/2016/11/conversion-attribution-markov-model-r/
Jules, first of all thank you for the awesome post.
One question came to mind when reading this, and it may have a really obvious answer that I may be missing out, so here goes my question:
¿why is it necessary to measure each visit as a goal? I mean, whats the difference of doing this and running Markov directly on the MCF without visits?
There it goes. Could it be that when not doing that extra step, you do get the path, but you dont know how many times someone visit your site through direct, or through organic? Clearly I dont have deep knowledge about how MCF in Analytics works, so would be glad to hear your answer.
Thanks for your time and keep up with the amazing work.
I am wondering the same thing!
Hi – Do you know why for Goal – Visits I am getting more than Sessions.
i.e. Visits Goal – 100, Sessions – 87
The conversion rate on this goal is above 100%, which shouldn’t be possible.
The session counter is only going up on interactive events. My guess is that you have some zero pageview visits. Possibly spam, possibly filters, possibly bad or missing tags.
Hi!
Very interesting approach! but why not use GTM to look for CID and then just fire one event for that user, instead of multiple “pageview” goals? Tracking the user instead of several pageviews is much more accurate imo. Because we all know that 99,9999% of all websites have multichannel problems because users are not linear. There no way to see for unique goals for that destination goal. Just my view.
ps. I came to this article through your article: https://stuifbergen.com/2016/11/conversion-attribution-markov-model-r/
Have you any new approach to that article?