Last update: 2020-07-31: Added fallback to old version of performance timing, to cover more browsers
In this post, I’ll guide you through all steps needed to collect, process, and analyse the Navigation Timing results of all your web site visitor’s page views.
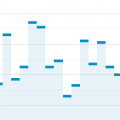
In the end, you’ll be able to make (hopefully nicer looking) dashboards like this:

This is going to be a long read, so grab a coffee, take a deep breath and read on. I’ll try to make the article as readable as possible.
The summary of what you will get
In this article I will provide you with
- all variables and code to implement in Google Tag Manager, so you won’t have to think (and click 632 times to create all the variables)
- the SQL to nicely model the data in an tidy non-nested table
- a step by step guide on how to set things up and use the data
On a high level, you will get:
- insight in you web page performance (trends and on a granular level)
- the ability to spot problems and bottlenecks per page
- to see if a new design or site release affected performance
For the high level stuff, you need to use your own judgement and put some effort in, but you will have the data needed to be able to get these insights.
The why and the what
Page Speed performance is incredibly important. Every millisecond counts, and you will lose customers, leads and SEO ranking if you have a slow site.
But how much business will you lose? Should I make my website faster? Do I have a business case? Can I spend $10,000 to make my site load faster?
It’s impossible to tell without having data.
So: I’m giving you data. Data from your web site visitors. In your own database. With free tools. The only thing you have to do is set it up.
Enter: the Navigation Timing API
Your web site visitor’s browser stores micro-second level data of its own performance. From how “heavy” your page is, when it connects, to how long it takes before it’s done loading, with all steps in between.
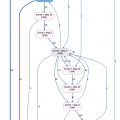
The image below shows you what timings are stored when a page loads in the browser.
These metrics can be read via a browser API using simple Javascript. And in this post, I’ll describe how to tap into this data and get it for every page that is visited on your website.
Note: This method uses the navigation timing API version 2, which is currently not supported in Safari.
To measure Safari users’ behaviour, it falls back to version 1, which is a bit less complete. (Updated this: 2020-07-31)
Steps to take and tools you’ll need
I will focus on the Google stack for this, since the tools are basically free, and widely used. You will need..
- access to Google Tag Manager for your website, or the ability to place a Tag Manager container and publish tags
- access to Firebase analytics, or: a Google Analytics App+Web property
- access to a Google Cloud project (with billing enabled) and enough rights to manage Big Query Tables
- Optional: a data modeling tool (I use Dataform) to schedule queries and manage tables
- Optional: A data visualisation tool like Google Datastudio or R and ggplot to query your data and make nice graphs.
Steps involved
The exact order is kind of flexible, but the most logical is the following. You might be able to skip some steps
- Set up a Google Cloud project and enable billing
- Create a Google Analytics App+Web property (via a Firebase Analytics project)
- Enable the streaming of Firebase data to Big Query
- Create / import a Google Tag Manager container and include it on your web site
- Set up data collection tag + variables in Google Tag Manager
- Next day: see if the data is in your Big Query events table
- Attach the event parameters to the event in the App+Web reporting user interface
- Use Big Query to create a usable dataset to work with
- Schedule the Query so you have daily fresh data
- Use the data to graph the data and find insights.
Let’s start!
Here, I’m going to redirect you to pages of others. Not that I don’t want to guide you through it, but this post would otherwise become way too long.
And the nice folks I link to explain it very well. You’re in good hands.
If you’re well into the Google Stack, you can probably skip most steps here.
Step 1: create a Google Cloud Project and enable billing
A Big Query database is living in the Google Cloud, and needs a project to run under. This is not free per se.
The free tiers are generous, but if you’re going to query more than 1 TB per month, or store lots of Gigabytes of data, it’ll cost you some dollar amount.
Start here: https://console.cloud.google.com/cloud-resource-manager
If this is your first project, you’re probably going to be eligible for $300 worth of free credits, which is a lot of query’ing and storing. You need billing enabled to your project, too. This is needed for Firebase later on, for the ‘pay as you go’ plan. (Which has, again, a very generous free tier).
You will now have
Step 2 and 3: Create an App + Web Analytics property (via Firebase) and enable streaming to Big Query
As is often the case, the prolific blogger Simo Ahava has written a nice howto that is better than the official documentation.
Follow the steps in his post carefully, and come back when you’re done.
Done? Awesome! I hope you managed to do it in a reasonable amount of time.
If all went well, you now have
- a Cloud Project
- a Big Query Analytics dataset (without tables, since you’re not collecting data yet)
- datasets generated by Firebase
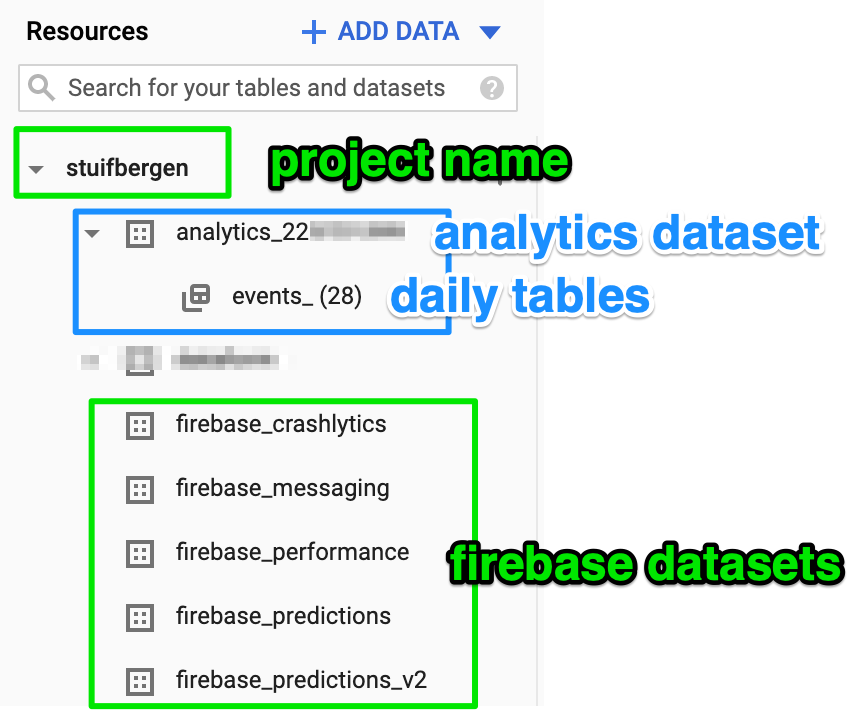
Time to populate the daily tables, let’s create the tags!
Step 4: Install a Google Tag Manager container on your web site
You’re probably already using Google Tag Manager on your site to manage tags. If that’s the case, make sure you have publish rights.
If you’re not.. you can start now. It’s fairly easy. Follow these steps: https://support.google.com/tagmanager/answer/6103696?hl=en
Import my container with the full configuration
I’ve made a pre-built container with
- A HTML tag that pushes the Performance Data in the dataLayer
- An App + Web configuration Tag
- An App + Web event tag that collects the data
- 24 variables, most of them performance timing variables
First, download the container file directly: raw json file or via the Github Gist Page of the container
Finally, import the container into your existing container, via the Admin section of GTM, like this:
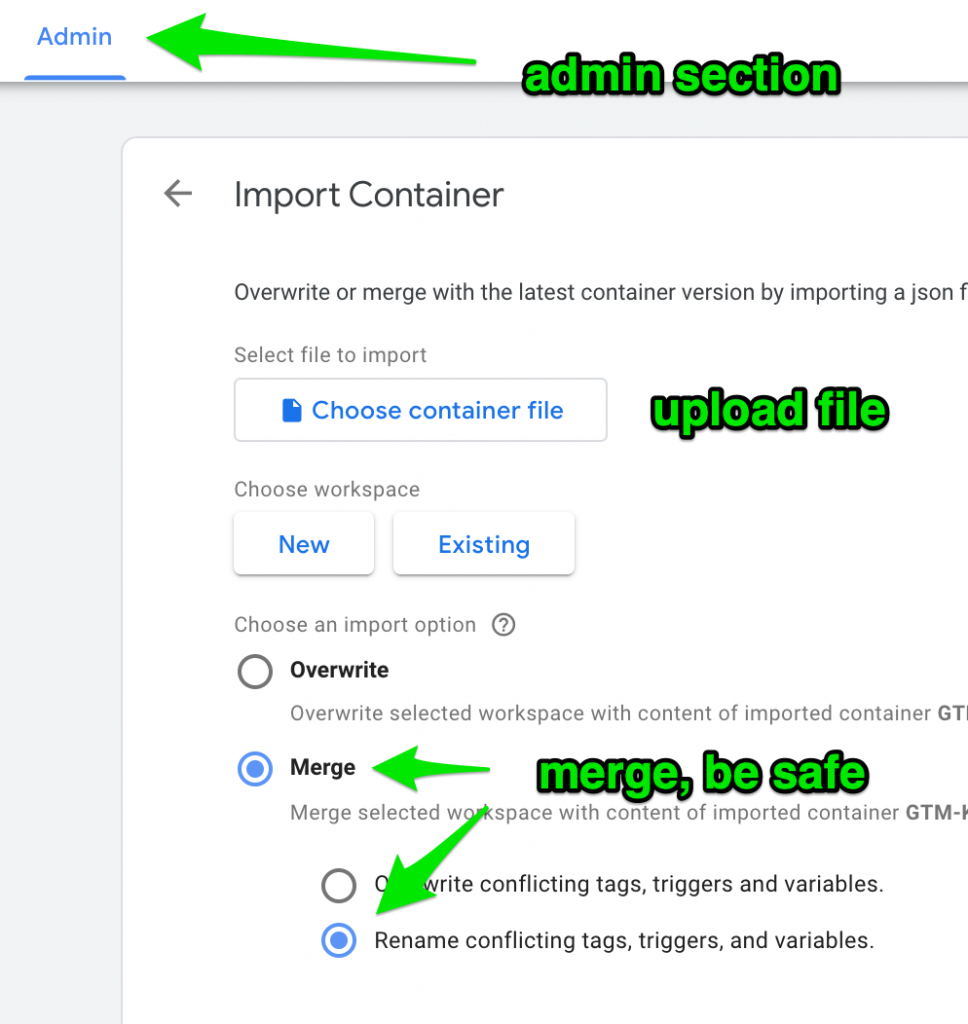
Make sure to Merge the imported data into your container. If you overwrite it, your other tags will be overwritten. That’s probably not what you want.
Step 5: Set up data collection tag + variables in Google Tag Manager
In order for the collection to work, you need to send it to the correct App+Web property. Remember? It’s the one you created in step 2.
It looks like G-123123 and can be found via Admin > Data Streams > Web in the Google Analytics interface.
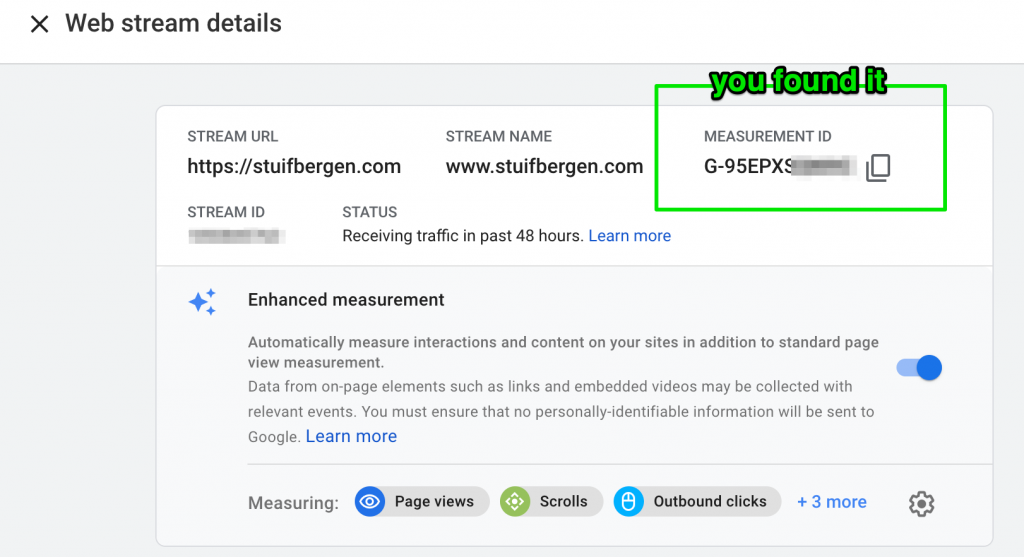
Details here: https://support.google.com/analytics/answer/9310895
Now, in the Tag Manager variable, go to the const variable, and paste the number in the box, and click save.
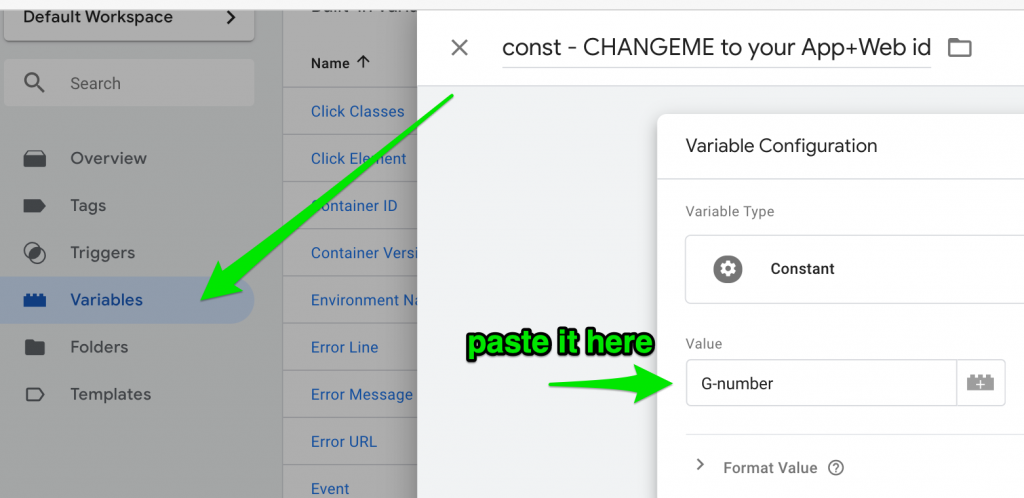
This will send the data to the property you have created. When you publish your container, it will start collecting data. You’ve now done most of the work, congratulations!
Before you publish, a bit of background on how it works
The tags, triggers and variables work like this:
On every page load (window.load event), a script tag is executed that collects the following information into the dataLayer, like this:
window.dataLayer.push( {{cjs - performance navigation event for dl}} );
- it signals the GTM event
performance navigation - it pushes the
navigation performanceobject to the dataLayer - it pushes data of
first_paintandfirst_contentful_paint
The actual App+Web event triggers on this performance navigation v1 or v2 event, and sends the data key/value pairs like this
| PARAMETER NAME | CONTENT |
| type | navigation type (navigate, reload, back_forward) |
| transferSize | INT – in octets, the complete transfer size, headers included |
| encodedBodySize | INT – in octets (8-bit blocks), the encoded payload size |
| decodedBodySize | INT – in octets (8-bit blocks), the decoded payload size |
| redirectCount | the number of redirects since the last non-redirect navigation under the current browsing context |
| redirectEnd | after receiving the last byte of the response of the last redirect (msec) |
| duration | difference between loadEventEnd and startTime (msec) |
| domComplete | time to dom complete/ready (msec) |
| domContentLoadedEventStart | time to dom content loaded event start (msec) |
| domContentLoadedEventEnd | time to dom content loaded event end (msec) |
| domInteractive | time to dom interactive (msec) |
| loadEventEnd | time when the load event of the current document is completed (msec) |
| loadEventStart | time when the load event of the current document starts (msec) |
| requestStart | time immediately before the user agent starts requesting the current document from the server (msec) |
| responseStart | immediately after the user agent receives the first byte of the response (msec) |
| responseEnd | immediately after receiving the last byte of the response (msec) |
| unloadEventEnd | zero, or time to unload event end (msec) |
| unloadEventStart | zero, or time to unload event start (msec) |
| redirectStart | before the user agent starts to fetch the resource that initiates the redirect (msec) |
| connectStart | The same value as fetchStart, or the time of the connection to the server to retrieve the resource |
| fetchStart | time to fetch start (msec) |
| domainLookupStart | the time of domain data retrieval from the domain information cache |
| first_contentful_paint | the time when the first paint happened that is visible/colourful (msec) |
| first_paint | the time when the user agent first rendered after navigation (msec) |
A note about the data collection: since the data is send on window load, and after some scripts are executed, your data will suffer from survivor bias. That is: you’re performance metrics are complete ONLY for people who were patient enough for the load entries to complete.
Preview and publish.. your data will arrive in a day.
The data will be sent immediately to Google Analytics APP + Web. However.. the Big Query dataset won’t be available yet. You’ll have to wait a day.
The App + Web interface can be quite slow to update, too, so don’t hold your breath while waiting for the events to pop up.
To check if the events are sent from within the browser, you can check the console logging.
I use the excellent Adswerve dataLayer inspector for this. You can add this to Chrome or Edge and debug like an analytics pro.
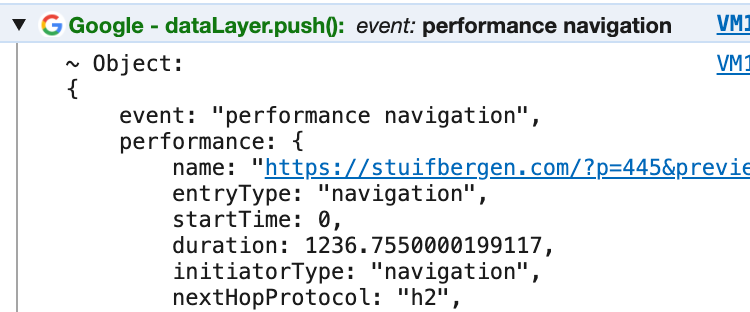
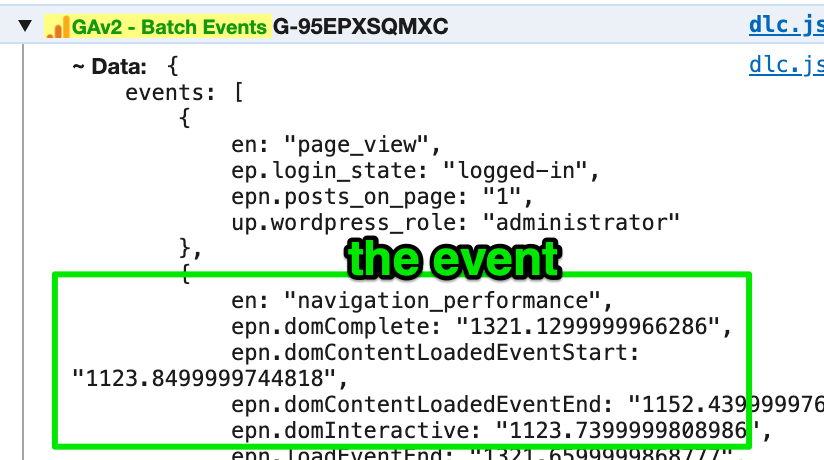
If you want to know what the request parameters to the Google Analytics endpoint mean, check out David Vallejo’s measurement protocol v2 guide. He has pre-emptively documented this for you.
Step 6: Next day: see if the data is in your Big Query events table
Good morning! Hope you slept well.
If you’ve set up everything up to here: kudos! Time to open a tab and see if your Big Query dataset has data.
Go to the Big Query web interface and select the correct project. Then look at the data via Preview of the table or via SQL. Something like this will work:
SELECT
  e.key as key,
  round(avg(e.value.int_value))    as avg_value_integers,
  round(avg(e.value.double_value)) as avg_value_doubles
FROM
  `PROJECTNAME.analytics_YOURNUMBERHERE.events_*`,
   unnest(event_params) AS e
WHERE
  event_name = 'navigation_performance'
AND
  _table_suffix > '20200412' -- replace this by a later date
GROUP BY 1
The output will look something like this:

Note that some values are integers (INT64), and some are doubles (FLOAT). There are also string values (like the type key).
In the Firebase or App+Web interface, you can attach the event keys and set the reporting type to match what is sent (string, integer, time, size, etc).
On to the next step!
Step 7: Attach the event parameters to the event in the App+Web reporting user interface
To make use of the reporting interface of Firebase Analytics, you can tie the event keys to the navigation_performance event, and set them to the correct type. This way, the reporting widgets treat numbers as numbers, and milliseconds as time.
First, go to either the App+Web interface under events or to the Firebase console and under Analytics -> Events select the navigation_performance events, click the three-dotted icon that appears, and choose Edit parameter reporting.

You will see an interface where you can ADD the parameters, choose the type and for numbers the type of the type.

Nice little task before getting coffee: ADD them all 24, set the type, and click save.
Note the interface sometimes chokes. I suggest saving in between, or else you have to re-click everything again.
Step 8: Use Big Query to create a usable dataset to work with
The Big Query database that stores the data is very nested. Very Big Query-like.
This is actually super elegant, since the whole “capture all events” schema that it uses is in fact, really simple: for every hit (event), is stores a list of key/value pairs, that can be un-nested if needed.
This elegance, however, makes the tables not very flat, And.. sometimes you want to actually look at your data. And human brains are not made for consuming nested data.
Time to transform the data to fit where it’s needed.
Sidestep: Nested data, wide data, long data
Nested data is good for storing data. After all, it represents the data structure, and you can add data without changing the schema.
There’s 2 other ways to store data: wide and long.
This is wide data. If you’re an Excel user, this format looks familiar.

And this is long data: it’s almost nested data, but with duplication. Every row has the same event ID.
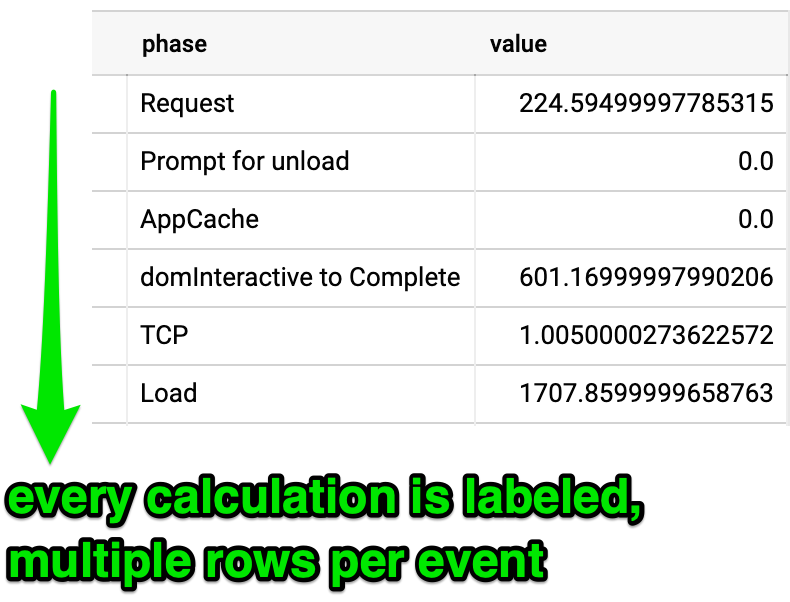
Every form has its use. In general:
- for calculations or grouping, you need wide data:
- domComplete – domInteractive = … msec
- average loading time per navigation type = …
- for Data Studio, you need wide data (precalculated or even raw metrics)
- for a breakdown, you will need long data:
- for easy graphing in
ggplot, long data is often the format you need.
Widen the data, Query 1.
The Wide Query can be found here:
https://gist.github.com/zjuul/0ae677de25a7be4760813b45696b4934
And this produces the wide dataset. You can use this in Data Studio to plot all metrics and break them down by
- device
- page path
- hostname
- page title
- device type
- user
- country
- navigation type
Furthermore, you can create new metrics, like intervals between two timings.
You cannot stack 2 metrics in Data Studio, however. For this, you need long data.
“Melt” / “pivot_long” the data: make it long
The query uses the wide dataset and makes it Long by phase in the request.
The query is here:
https://gist.github.com/zjuul/e56cd50b759315c654031eeeaac5cfb6
And you can do stuff with it like this, to see performance over time:

Step 9: Schedule the Queries so you have daily fresh data
Now you have nice tables, you might want to use these with fresh data, and not type them in every time.
Couple of options here:
Use the built in “Schedule Query” option in Big Query, or even: Create a View (always fresh, slower, but might be more cost effective if you don’t use it often). Pick one.

Use a data modeling tool
Now you’re busy modeling data, you can opt to go for a specilalised external tool.
My favorite one is Dataform at the moment. It has version control, schedules, automatic depencency mapping, and documentation generation. And it has a free 1-person tier. Try it! (No affiliation, I just love the tool).
Step 10: Use the data to graph the data and find insights
Wow, step 10 already.
- you have data
- you have modeled it
- now use it! That’s what it’s for, after all..
Data Studio to see insights
We all love and hate Data Studio. It can do so much for free!
You can add the long and wide datasets to a report by choosing Big Query and then navigate to the datasets.

Then, you can spend hours tweaking graphs and making pretty designs to impress your boss, clients and coworkers.
Example report using a 100% stacked bar, per page, breakdown by Phase.

Add filters for device, navigation type, country.. the possibilities are endless.
Use R to calculate impact of speed on conversion
You don’t have to stay in the Google stack. You can pull data in R to mode page speed in relation to web site behaviour.
After all, you have a user-id and client-id in the data, so you can join the data to outcomes.
Maybe you’ll end up with a great business case to justify spending money on improving the speed of your site.
And make your users happy.. they all like speedy sites!
Finally..
This turned out to be quite a lengthy blog post. I hope it is useful to you. If so: let me know. Tweet me @zjuul, leave a comment, or find me in real life (after the lockdown).
Thanks you for your attention, and happy optimizing!

Leave a Reply