Stuifbergen.com

Analytics & Growth Hacking

  • About
  • Contact
  • Professional Services

Find me here

  • Mastodon (social)
  • Mastodon (measure)
  • No more Twitter

Doing Cohort Analysis in R (using ggplot)

9 March 2018 by jules 13 Comments

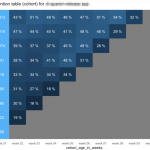
In this post I’ll describe how to build a nice cohort graph/table in R, using ggplot2.
Data source that I’m using is from a mobile app that is tagged with Snowplow Analytics, but if you follow all the steps, using a similar dataset, you’ll get the same results.

Recent Posts

  • Analyze AB tests in GA4 via Big Query
  • How to make sure your GA4 events tables do not expire
  • Prepare your cloud project for “Bulk data export” Google Search Console
  • Making Sense of the GA4 Configuration Tag
  • Using Big Query to calculate DAU / MAU

Need help?

  • Contact me

Search

© Copyright Jules Stuifbergen · Powered by Genesis ·