Hello, analyst! This post is about Conversion Attribution Modeling using Google Analytics (multi channel funnel report data) and the R programming language. Quite a mouthful.
It’s a follow-up post on an earlier blog I wrote on multichannel conversion rate.
I’m not going to tell you long stories on why you need this.
In short: use this script..
- If you want to know the conversion rate of each path (multi-touchpoint path)
- If you want to model the value of each point in the path.
The path I’ve chosen to get from Google Analytics is the source/medium path. You can choose the Campaignpath or similar quite easily, it depends on what you want to know. Just change the configuration of the script.
What you need before running this script
You need Google Analytics (gasp!) but, with a twist. You should create a view where you configure a Goal that is counted for every visit to the site. For more details on how to do this, read my blogpost on multichannel conversion rate.
You also need to download and install the R programming language. It’s freely available, open source, and there’s a nice GUI available (RStudio) as well. You’ll love it (it has a quite steep learning curve (challenge!) and an awesome community that can help you out (love!))
After setting things up, fire up R, and install the two packages you need: GoogleAnalyticsR and ChannelAttribution. We’re going to use these libraries to do all the hard work for us.
install.packages('googleAnalyticsR')
install.packages('ChannelAttribution')
After that, you’re ready to go!
The Script and the script configuation: a 1-minute setup
Let’s first paste the script here, so we can discuss it. It’s also on Github!
Configuration lines are line 17 to 28, and the script has plenty of comments and is not very complex.
# multi channel attribution and path conversion rate calculation.
#
# see https://stuifbergen.com/2016/11/conversion-attribution-markov-model-r

# install.packages('googleAnalyticsR')
# install.packages('ChannelAttribution')

library(googleAnalyticsR)
library(ChannelAttribution)

# auth first - this opens a browser (first time)
# ga_auth(new_user = TRUE)
# this one doesn't (refreshes token)
ga_auth()

# view id of your Google Analytics view where 1 conversion = visit
vid <- "115546653"

# transaction filter
trans_filter <- "mcf:conversionType==Transaction" # the conversion you're interested in
visit_filter <- "mcf:conversionGoalNumber==012"   # "visit" conversion

# date range
from <- "2016-09-01"
to   <- "2016-09-30"

# what do you want to know the attribution of?
dim = "sourceMediumPath"

# the function
get_data <- function(vid, from, to, filters = "",
                     dim = "sourceMediumPath", max = 5000) {
  df <- google_analytics_3(id = vid,
                         start = from, end = to,
                         metrics = c("totalConversions"),
                         dimensions = dim,
                         filters = filters,
                         type="mcf",
                         max_results = max)
  # clean up and set class
  df[,1] <- gsub(" / ", "/", df[,1])              # remove spacing
  df[,1] <- gsub(":?(NA|CLICK|NA):?", "", df[,1]) # remove CLICK and NA
  df[,2] <- as.numeric(df[,2])                    # conversion column is character :-/

  # return the dataframe
  df
}

# get transactions
transactions <- get_data(vid=vid, from=from, to=to, dim=dim, filters=trans_filter)
colnames(transactions) <- c("path", "transactions")

# get visits (remember: this view has a goal where a visit = a conversion)
visits       <- get_data(vid=vid, from=from, to=to, dim=dim, filters=visit_filter)
colnames(visits) <- c("path", "visits")

# merge dataframes, based on path
alldata <- merge.data.frame(visits, transactions, by = "path", all=T)
# not all visit paths have conversions. Change those NA's to zero.
alldata[is.na(alldata$transactions), "transactions"] <- 0

# calculate conversion rate
alldata$rate <- alldata$transactions / alldata$visits
# null = visits without transaction
alldata$null  <- alldata$visits - alldata$transactions

# run the markov model
mm <- markov_model(alldata, var_path = "path",
                   var_conv = "transactions",
                   #var_value = "value", #use this if you have conversion values
                   var_null = "null",
                   order=1, nsim=NULL, max_step=NULL, out_more=FALSE)


# run the heuristic model
hm <- heuristic_models(alldata, var_path = "path",
                       #var_value = "value",
                       var_conv = "transactions")

# merge mm + hm, and voila.. your modeled acquisition sources
modeled <- merge.data.frame(hm, mm, all=T, by="channel_name")

# and View it (Rstudio)
View(alldata) # the conversion rate of each path
View(modeled) # the attribution table per channel
So: you need to input the following:
- The ID of your Google Analytics View (in GA under Admin > View > View Settings)
- The Goal that you care for (In this script, I user Transactions, since I run a little webshop)
- The Goal you configured where every visit counts as Goal. In my case I use Goal 12: mcf:conversionGoalNumber==012
- Your date selection (from and to)
- Optionally, you can choose something else than sourceMediumPath to use as referrer indicator.
Running the script and interpreting the output
When the script runs, you’re first redirected to a browser to allow you to give this script read-access to your Google Analytics data via the API.
After that, the data is pulled in via the API, cleaned up a bit and the calculations can be made.
Conversion rate per path
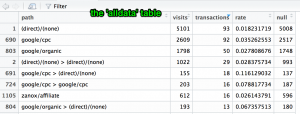
This is stored in the alldata table. It simply shows the visits, the transactions, and the conversion rate (as well as a “null” column, which is the number of non-converting visits).
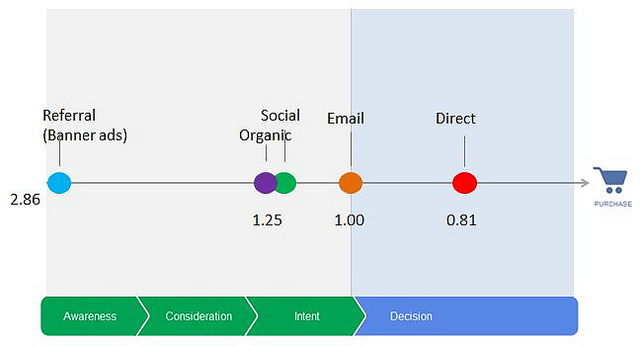
Attributed conversion rates, modeled in 3 ways
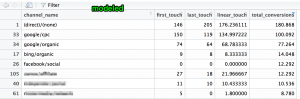
This is stored in the modeled table. It shows each channel (in the sourceMediumPath) individually, along with the assigned number of conversions according to 3 models.
Please note: if your transactions have different goal values, you can use this as well. See the documentation on the ChannelAttribution package for details.
This table has 4 metrics in it:
- First Touch – Last Touch: assign all conversions to the channel of the first/last visit
- Linear Touch: assign equal value to all touchpoints
- total_conversions: use a Markov Model
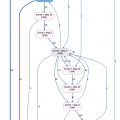
Markov Model (Markov Chains)

A Markov Chain model deals with probabilities of switching from one state (touchpoint in this case) to the next state. Our freshly installed R package does all this wonderful calculations for us, and provides us with the number of conversions that can be attributed to each touchpoint, as well as the value of each touchpoint.
Please read the documentation on the ChannelAttribution package for more info.
Next step..
Save your data-output to Excel or a text file, and adjust your campaign budget to be more efficient. But note: since we’re tracking users here, PLEASE consider implementing unique user tracking, and use proper device (mobile, desktop, table) segmenting to be sure you know what’s going on.
Now go ahead, and be awesome!
Questions / Feedback? Leave a comment, or tweet me @zjuul. Thanks!

Great stuff, This article solved most of the issues I had, but Attribution model provide only user level data for 90days. If you have workaround for this please give me a hint.
How to deal if a certain customer receives a confirmationmail, and in turn clicks to your website. In such situation, the involved customer ends up in different paths for the transaction and visit flow.
Great post.
How do i adjust the lookback window in the code(days)? I am not getting the same conversions as in GA, i think it’s related to the that.
Great post. Just one question – how can I create picture of Markov model (the chain)?
I get the tables, but not the picture.
Thanks!
Great work with the script!
One question, how can I also apply a filter on the paths with Interaction Type (Impression, Click, Direct, Rich Media)?
Great post! Thanks for this!
Can you help me solve this error?
Request to profileId: ()
Error in `colnames<-`(`*tmp*`, value = "totalConversions") :
attempt to set 'colnames' on an object with less than two dimensions Warning message: In ga(pars_arguments = ga_pars) :
API Data failed to parse. Returning parsed from JSON content.
Use this to test against your data_parse_function.
Thanks a lot for this post! Script and Goal hack of visit in GA really well put together!
I have the same issue:
Error in `colnames Any idea how to solve this?
Best,
Gustavo B
Thank you so much for posting this article.
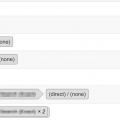
I have only one comment – if there are spaces in the path/channel names the Markov model section doesn’t work as expected / it breaks. E.g. “Newsletter June 2016” becomes more than one channel (and it doesn’t split by the spaces, either). My current workaround is to substitute all the spaces with underscores and then replace the spaces around the > character. I hope that helps others.
Whenever I want to get my custom channel grouping from Google Analytics, I get the following error message:
> dim = “MCF_Channel_Grouping_JG”
> transactions <- get_data(vid=vid, from=from, to=to, dim=dim, filters=trans_filter)
Request Status Code: 400
Show Traceback
Rerun with Debug
Error in checkGoogleAPIError(req) :
JSON fetch error: Unknown dimension(s): mcf:MCF_Channel_Grouping_JG
For details see https://developers.google.com/analytics/devguides/reporting/core/dimsmets.
Hi,
There was an update of the library(googleAnalyticsR)
you need to write “google_analytics_3” to make the script work
Thanks Justine!
Hello,
Great post, it’s working nice, except I’m not getting total_conversion_value in ‘modeled’ data – it’s always 0 for each sourceMedium in Markov Model. However, heurisitic models have conversion value – only Markov model doesn’t. Do you have any ideas why I’m getting 0?
I have the same issue. Have you solved it?
I also ran into this. It seems that for the views that don’t get as many visitors the package cannot compute a markov value but only number of conversions. For the views with more visitors the attribution works. It depends on the timestamp you want to run the model I guess..
I don’t have visits set up as goals. What is the work around ? Thanks!!!
Set it up, and data will start coming in. No workaround known for historical data.
Best way is to copy your main view into a new view (so everything is set up the way you’re used to), and then add the visit = goal.
Dear Jules,
Great post! I have a question regarding how to track unique user interactions. We are able to identify users cross devices via custom dimensions. How to use such data in multichannel reports. One way I think of is to build USER ID|sessions_timestamp|source/medium dimension report and create paths. Would this be best approach?
If I have data with the conversion rate for each channel, can I run the markov model directly on this or must I have the number of transactions and the total number of visits for each channel?