 About a year ago, I read this post about using Process Mining techniques on click paths by Joao Correira. In this post, he mentioned the Disco tool to analyse website data from BigQuery.
Disco is a very nice tool, very user friendly and easy to use. However.. it is made to optimize your business processes, and priced accordingly. It is quite expensive.
So, I turned to my favorite free tool: R and found a wonderful process mining package: bupaR. In this post, I’ll explain the basics that will get you started. Let’s go!
Using the R package ‘bupaR’
The documentation of the bupaR package is very good, and you can follow the examples quite easily. However: creating an event log from web analytics data requires some data wrangling to fit in the correct format. Here’s how I dit it (based on the bupaR explanation. Read it to become enlightened.
Create the event log object
First, I query the web analytics database, exactly in the format I want. See “Source file 1” at the end of this post. Then, I map the query result to event log fields. The mapping I use is as follows:
- Every visitor is a “case”. So I use browser cookie as case ID
- Every page visited in the funnel is an “activity”. I use the page name as activity ID
- A “lifecycle” is e.g. a “page view” or “page ping”. In my source, I use “start” and “end”, based on the timestamps of the page_view_start and page_view_end . This is optional, you can call every activity a “view”.
- The activity instance ID is needed to group the lifecycles together. So “start” and “end” of the same pageview are given the same ID. I use the table row numbers for that.
- Finally, I also use the “resource” field. I fill this with “device type”, so I can segment by device really easy.
The R code
library(bupaR)

# I use the table "query_results" with my analytics data
# run it from a query or run:
# query_results <- read.csv("./query-results.csv")

log <- query_results %>%
  eventlog(
    case_id = "case_id",                           # the user id (browser cookie)
    activity_id = "activity_id",                   # this contains the page name that is viewd
    activity_instance_id = "activity_instance_id", # all user activity from that page view
    lifecycle_id = "lifecycle_id",                 # page activity: one of 'start' or 'end' per page (funnel-step)
    timestamp = "timestamp",
    resource_id = "resource_id"                    # I fill this with device_type
  )
Ready? Now create pretty graphs
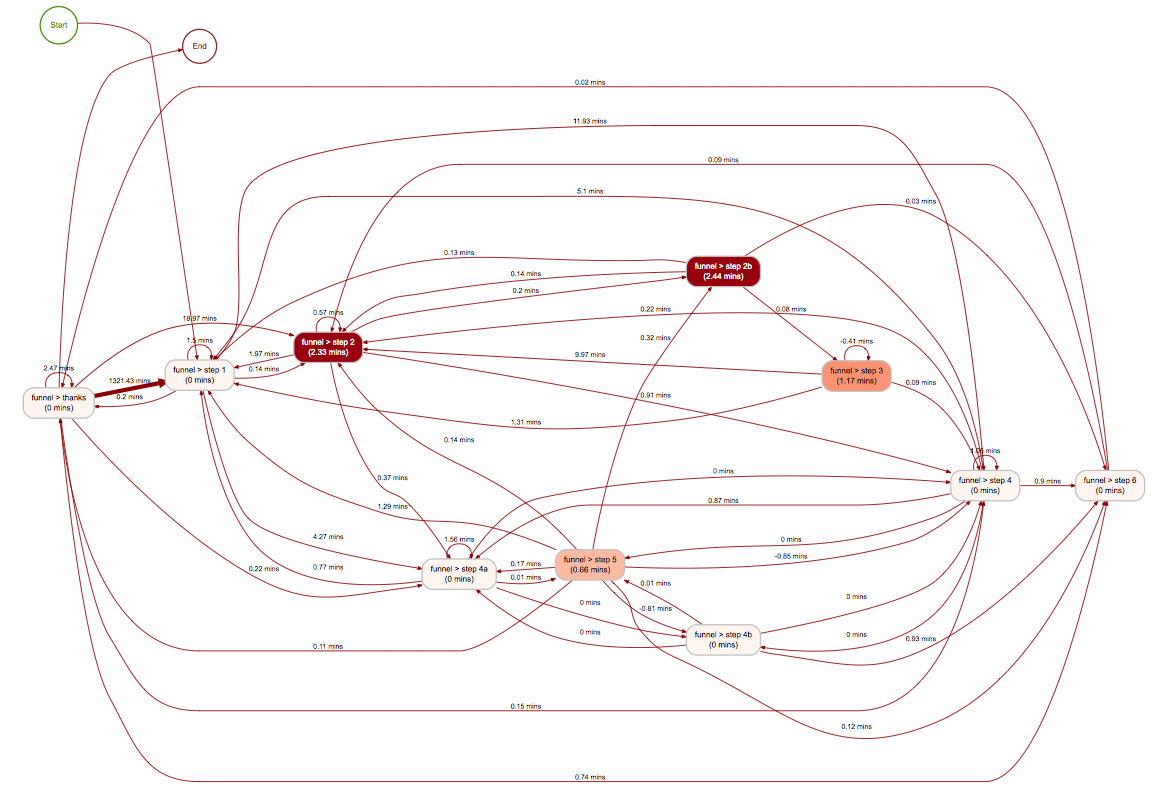
 I won’t go into detail now on how to do in-depth process analyses on this data. Please refer to the bupaR docs, or follow the examples in my code appendix (see below). But, you’re here for the pretty graphs, so I give you pretty graphs. On the left (click for big), you can see a process map, created from the log. I generate it like this
# process map (with frequency filter to simplify)
log %>%
  filter_trace_frequency(perc = .8) %>%
  process_map(rankdir = "TB")
Pretty easy, once you have your log! See the source code below for more examples.
User processmonitR dashboards
One thing you can do with this as well, is to create your standard funnel bar graph. using the processmonitR package “dashboard” commands. 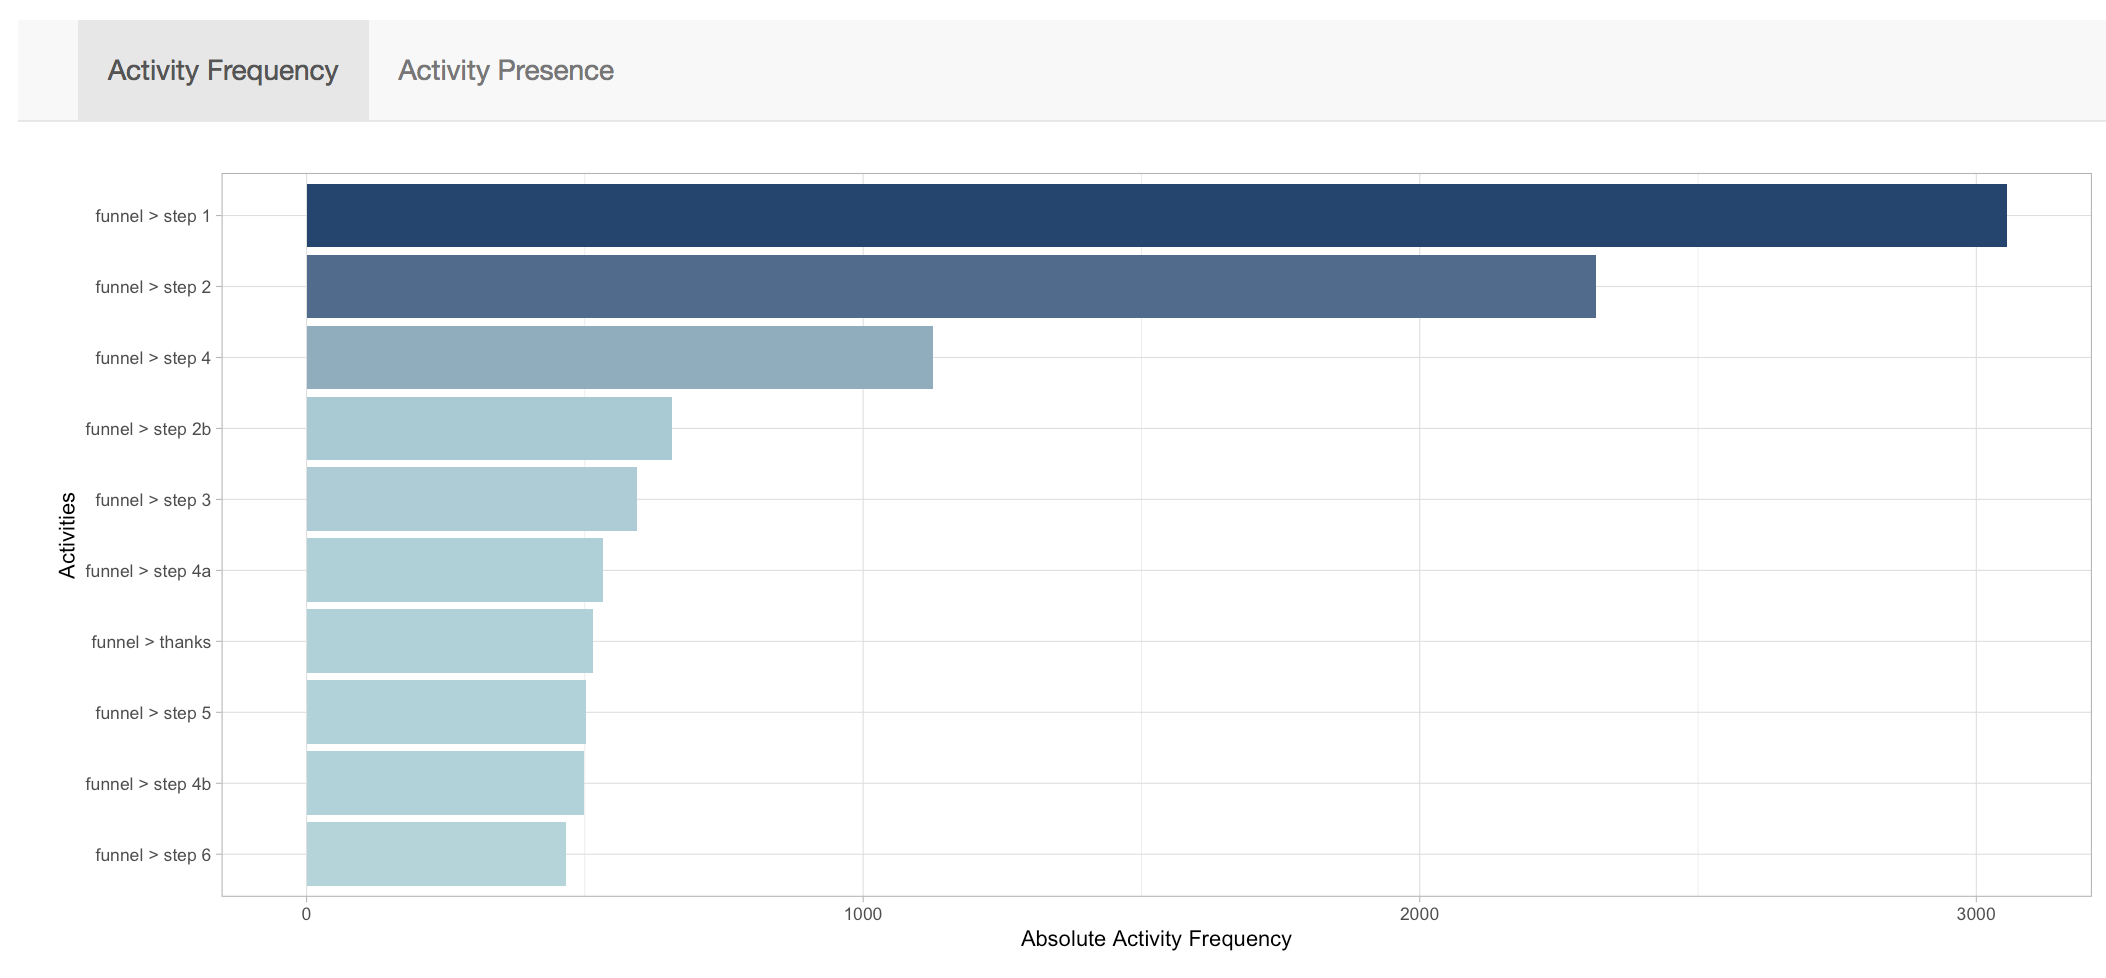
This almost looks like a web analytics report :) Again, once you have your log file, it’s working like magic.
# the processmonitR package contains some dashboards. Try them like this:
library(processmonitR)
activity_dashboard(log)
Try it yourself
Now, go out and play! If you have any additions or questions, ask them below. Tip: This coursera course explains a LOT about process mining, algorithms and techniques. You will see that a “customer journeys as processes”-view of the world will open up a lot of interesting new possibilities of exploring and analyzing your data. Happy Hacking! Appendices:
Source file 1: Create the event log (in SQL)
This query creates a selection from the Snowplow web model web.page_views table. This table has “page_view_start” and “page_view_end” columns (timestamps), so I use two queries to create two rows for those in the log. Change this to suit your needs.
-- select a subset of raw data: all "funnel" pages
with subset as (
  select
    user_snowplow_domain_id as case_id,
    page_structure as activity_id,
    page_view_start,
    page_view_end,
    device_type as resource_id,
    row_number() over (order by page_view_start asc) as activity_instance_id
  from
    web.page_views
  where
    page_view_start > '1970-01-01'   -- select your own date range
  and
    page_structure like 'funnel > %' -- change this to match your funnel pages
)

-- now select the page view start timestamp as activity start time
select
  case_id, activity_id, resource_id, activity_instance_id,
  page_view_start as timestamp,
  'start' as  lifecycle_id
from
  subset

union -- and union this with a an 'end' event (page_view_end > page_view_start time)

select
  case_id, activity_id, resource_id, activity_instance_id,
  page_view_end as timestamp,
  'end' as lifecycle_id
from
  subset
where
  page_view_start < page_view_end;
Source file 2: complete R code
library(bupaR)

# create log file from query

log <- query_results %>%
  eventlog(
    case_id = "case_id",
    activity_id = "activity_id",
    activity_instance_id = "activity_instance_id",
    lifecycle_id = "lifecycle_id",
    timestamp = "timestamp",
    resource_id = "resource_id"
  )


# show activities (text)
filter_activity(log, c("funnel > step 1", "funnel > thanks")) %>% activities
activities(log)

# resources
resource_frequency(log, "resource-activity")

# process map trim
log %>%
  filter_trim(start_activities = "funnel > step 1", end_activities =  c("funnel > thanks")) %>%
  process_map(type = performance(FUN = median, units = "mins"))

# using endpoints
log %>%
  filter_endpoints(start_activities = "funnel > step 1", end_activities =  c("funnel > thanks")) %>%
  process_map(type = performance(FUN = median, units = "mins"), type_nodes = frequency("relative"))

# process map (with frequency filter to simplify)
log %>%
  filter_trace_frequency(perc = .8) %>%
  process_map(rankdir = "TB")

# precedence plot, 2 variations
log %>%
  precedence_matrix(type = "absolute") %>%
  plot

log %>%
  precedence_matrix(type = "relative_consequent") %>%
  plot


# resource matrix (not really useful if you don't have cross-device
log %>%
  resource_matrix() %>%
  plot()


# the processmonitR package contains some dashboards. Try them like this:
library(processmonitR)

resource_dashboard(log)
activity_dashboard(log)

To create the event log for GA:
GA Client ID (a Custom Dimension (CD) in GA) is the case ID.
Page Name is the activity ID.
The activity instance ID is needed to group the lifecycles together. So the first page or event is “1”, page 2 is “2”, page 3 is “3”, etc.
A “lifecycle” is the Session ID (another CD in GA)”.
Timestamp (a custom Dimension in GA) is the timestamp.
Finally, Device Type is the “resource” field.
Did I get that right?
Yep, that’s right
Thanks a lot for the article.
Do you have an example using BigQuery, and how to prepare the data set for this example?
Thanks